
Training

Monitoring, Evaluation & Learning (MEL)
This training course covers seven key areas designed to strengthen participants' knowledge and practical skills in planning, implementing, monitoring, and evaluating development programmes.
-
Build a results framework: SMART indicators, baselines, and targets aligned to OECDDAC criteria. Leave with a draft framework and plan ready for stakeholder review and use.
-
Write a robust ToR: purpose, scope, questions, methods, timeline, and roles. Embed ethics and inclusion, then proceed confidently to procurement and quality fieldwork.
[Find more infor here] -
Design clear survey instruments. Plan a pilot, refine wording and flow, and implement skip/validation logic to improve data quality and respondent experience.
-
Build and deploy Kobo forms. Set enumerator standard operating practices, monitor for quality, and clean exported data—so your results arrive ready for analysis and reporting.
-
Clean datasets and publish an interactive Power BI dashboard. Use sensible visuals and update routines so stakeholders can produce their own accurate insights.
-
Map data flow endtoend, define roles/RACI, templates, and timelines. Create a practical monitoring system that supports timely decisions and learning.
-
Produce short, decisionoriented reports. Choose clear charts, maintain contrast, and present findings that stakeholders can quickly understand and act upon.
Indicator & Logframe Design (MEL-1)
Objectives
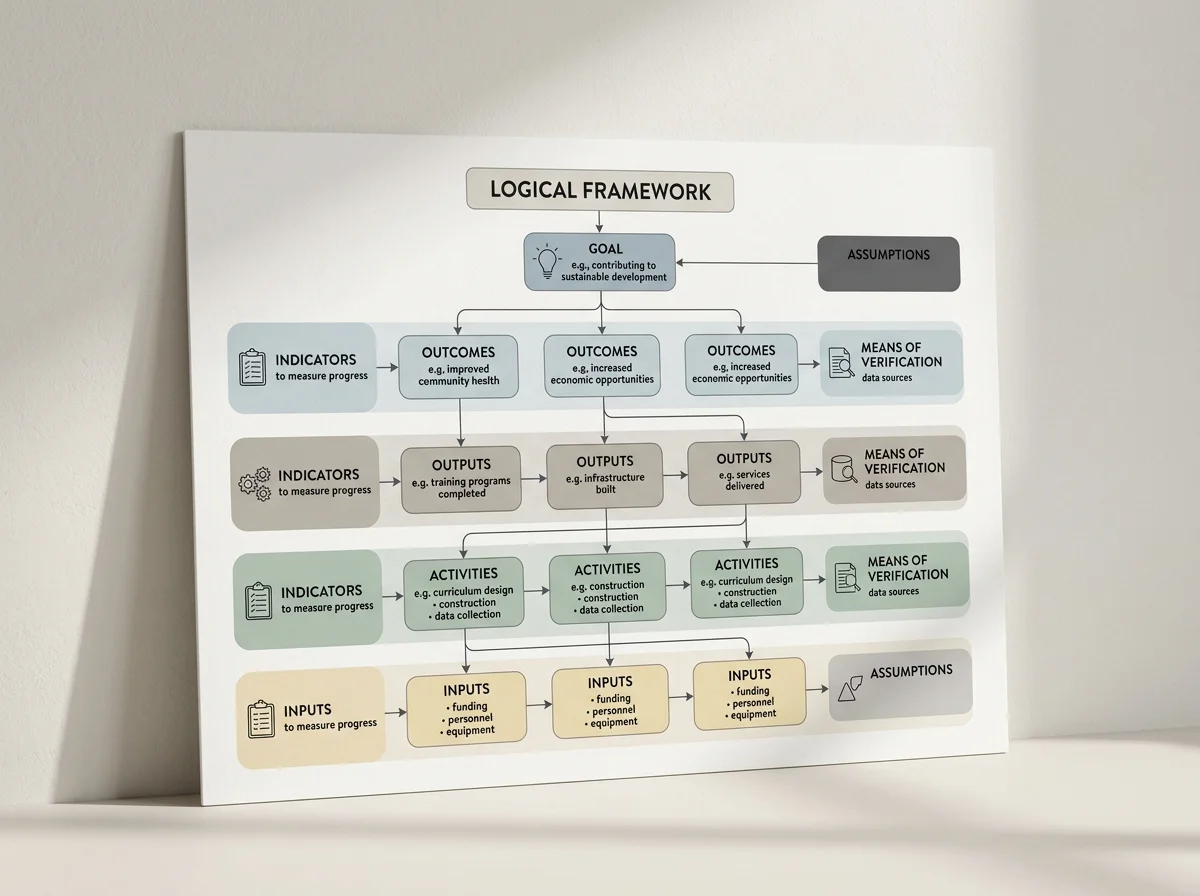
Draft a results framework and SMART indicators.
Set baselines and targets with means of verification.
Align the framework to OECD‑DAC criteria
What you’ll learn
You’ll connect your Theory of Change to a practical logframe, choose indicators people can measure, and record baselines/targets clearly—so monitoring is feasible and useful.
How it helps
You’ll leave with indicator sheets and a logframe donors recognise, helping teams collect the right data and review progress credibly.
Evaluation ToRs That Get Quality Work (MEL‑2)

Write an Evaluation ToR covering purpose, scope, questions, methods.
Define roles, timelines, budgets, and deliverables.
Embed ethics, inclusion, and DAC criteria clearly.
Objectives
We’ll use UNICEF’s ToR quality checklist to define realistic questions, sampling/methods, timelines and budgets, plus ethics and inclusion notes your reviewers expect.
What you’ll learn
You’ll have a complete ToR ready for procurement—raising evaluation quality from the first step and supporting credible, actionable findings.
How it helps
Survey Question Design & Testing (MEL-3)

Draft clear survey questions and response options.
Plan and run a pilot.
Implement skip/validation logic to improve data quality.
Objectives
What you’ll learn
Using UNICEF MICS patterns, you’ll write questions respondents can answer and plan quick pilots to catch wording or logic problems before fieldwork.
You leave with a tested instrument and a pilot log, reducing poor data and rework during baseline or monitoring rounds.
How it helps
Baseline Implementation with Kobo(MEL‑4)
Build and deploy KoboToolbox forms with skip/validation.
Set enumerator operating procedures and field quality assurance (QA) routines.
Export clean datasets for analysis and reporting.
Objectives
You’ll design and publish forms, manage offline/online collection, and set simple QA steps (back‑checks, validations) so your baseline data arrives clean.
What you’ll learn
You’ll leave with a live Kobo form, field operating procedures, and export routine—cutting delays between fieldwork and analysis.
How it helps
Survey Analysis & Dashboards Power BI (MEL-5)

Objectives
Build an interactive Power BI dashboard with key disaggregations.
Set a refresh operating procedure and visual standards people trust.
We’ll cover data modeling, core DAX measures, time analysis, and visual design, using Microsoft Learn modules so your dashboard is maintainable and clear.
What you’ll learn
You’ll publish a dashboard that stakeholders can use themselves—reducing report cycles and supporting faster decisions.
How it helps
Designing a Monitoring System That Teams Follow (MEL‑6)

Map data flows, roles (using RACI), and templates end‑to‑end.
Set a realistic reporting plan and governance.
Integrate learning/adaptive management into routine practice.
Objectives
Using the World Bank’s results‑based M&E approach, you’ll design a system that fits your capacity and decision needs, not just donor compliance.
What you’ll learn
How it helps
You’ll leave with a MEL system map, data dictionary and calendar—so teams know who collects what, when, and how findings reach managers.
Reporting for Decisions (MEL-7)

Objectives
Write short, decision‑oriented reports and briefs.
Choose charts, colours, and labels that are clear and accessible.
Present findings stakeholders can act on quickly.
We’ll practice concise text, correct chart selection, and contrast/labeling that improves readability—using recognised guidance rather than guesswork.
What you’ll learn
Your reports become faster to read and easier to trust, helping meetings focus on decisions, not understanding graphics.